Information
 Graphs and charts by postalcodeinfo.ca are licensed under a Creative Commons Attribution-ShareAlike 2.5 Canada License.
Based on a work at https://postalcodeinfo.ca/on/oshawa/census-data-statistics/.
Oshawa, ON General Statistics
Oshawa by the Numbers
Population (2011)
149,607
Population (2006)
141,590
National Population Rank (2011)
31
National Population Rank (2011)
15
Land Area (sq. km)
145.6767
Population Density
1,026.9796
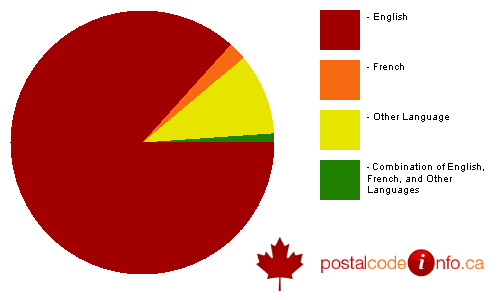
Oshawa Languages Spoken
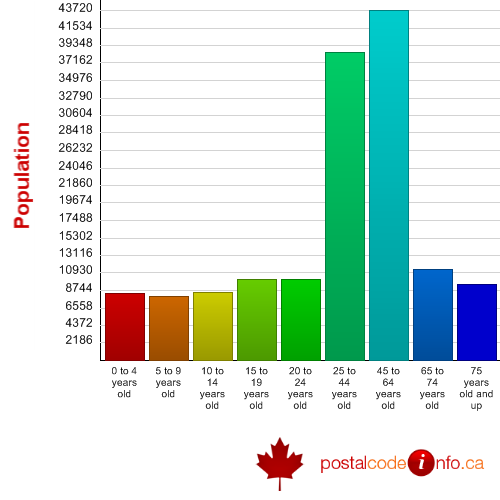
Oshawa Age Distribution
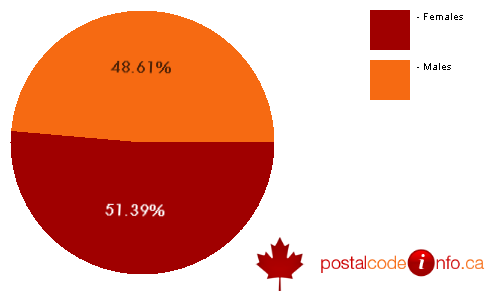
Oshawa by Gender
Graphs and charts by postalcodeinfo.ca are licensed under a Creative Commons Attribution-ShareAlike 2.5 Canada License.Based on a work at https://postalcodeinfo.ca/on/oshawa/census-data-statistics/.
* - Contains data licenced "as is" under the Government of Canada Open Data Licence Agreement. Such licencing does not constitute an endorsement by the Government of Canada of this product.