Information
 Graphs and charts by postalcodeinfo.ca are licensed under a Creative Commons Attribution-ShareAlike 2.5 Canada License.
Based on a work at https://postalcodeinfo.ca/on/toronto/census-data-statistics/.
Toronto, ON General Statistics
Toronto by the Numbers
Population (2011)
2,615,060
Population (2006)
2,503,281
National Population Rank (2011)
1
National Population Rank (2011)
1
Land Area (sq. km)
630.2147
Population Density
4,149.4748
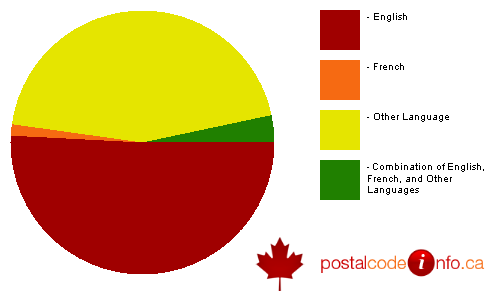
Toronto Languages Spoken
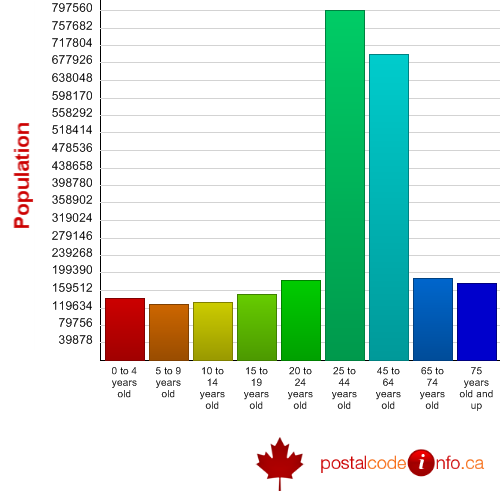
Toronto Age Distribution
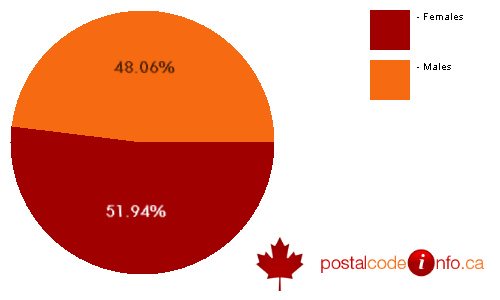
Toronto by Gender
Graphs and charts by postalcodeinfo.ca are licensed under a Creative Commons Attribution-ShareAlike 2.5 Canada License.Based on a work at https://postalcodeinfo.ca/on/toronto/census-data-statistics/.
* - Contains data licenced "as is" under the Government of Canada Open Data Licence Agreement. Such licencing does not constitute an endorsement by the Government of Canada of this product.